By Brian French | PressReleaseFlorida.com | September 16, 2026
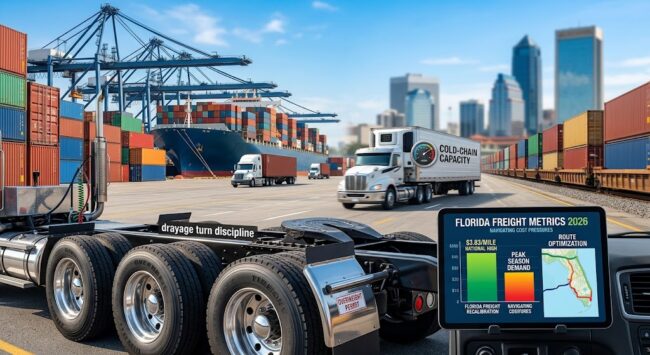
Quick Answer: Florida’s freight and logistics operators are absorbing the sharpest cost swing in three years. Truckload spot rates hit an all-time national high in June after a long freight recession, diesel remains elevated, and drayage at PortMiami and Port Everglades is pricing accordingly. In response, distribution hubs and fleet operators across Jacksonville, Tampa Bay, and South Florida are shifting cargo to closer ports, tightening drayage turns, investing in route optimization and cold-chain capacity, and using Florida’s four major container gateways as a hedge against any single lane. The strategy is margin resilience, not growth at any cost.
The Setup: A Market That Flipped
For most of 2023 through early 2026, trucking was a buyer’s market. Nearly three years of freight recession depressed rates and steadily reduced motor carrier counts across the industry. As recently as January 2026, Florida dry van spot rates averaged $2.25 per mile with contract rates at $2.44, and refrigerated transport commanded $2.62 spot and $2.80 contract. Freight destined for Florida has always carried a structural penalty: limited outbound volume creates imbalanced lanes, so carriers price the empty return leg into the inbound move.
Then the market turned. SONAR’s National Truckload Index reached an all-time high of $3.83 per mile in June, according to ITS Logistics’ monthly Port/Rail Ramp Freight Index — a reading that eclipsed COVID-era peaks. ITS warned that ocean and rail drayage markets would tighten as soon as July when peak season began, and that inland container haulage rate increases were a question of when, not if.
Fuel compounded the problem. Diesel prices remained elevated through the spring, filtering directly into drayage costs at East Coast ports and Gulf gateways. South Florida forwarders advised importers moving containers through PortMiami or Port Everglades to plan for drayage costs to reflect that, and told ocean shippers not to expect rates to drop meaningfully before Q3.
For a Florida distribution operator, the arithmetic changed in a single quarter: the per-mile cost of getting a container from dock to warehouse rose, fuel surcharges rose, and the carrier pool that had been shrinking for three years could not expand fast enough to meet peak-season demand.
Key Facts at a Glance
| Metric | Figure | Period |
|---|---|---|
| National Truckload Index (SONAR) | $3.83/mile, all-time high | June 2026 |
| Florida dry van spot rate | $2.25/mile | Jan. 2026 |
| Florida reefer spot rate | $2.62/mile | Jan. 2026 |
| JAXPORT containers | ~1.39M TEUs (+4%) | FY2025 |
| Port Everglades containers | 1,167,552 TEUs (record) | FY2025 |
| PortMiami containers | 1,115,058 TEUs (+2.35%) | FY2025 |
| Port Tampa Bay containers | ~263,000 TEUs (+300% since 2018) | FY2025 |
| PortMiami base drayage | From $500/container | 2026 |
| Port Everglades base drayage | From $450/container | 2026 |
Jacksonville: Scale and Rail as the Buffer
JAXPORT is the state’s largest container gateway and the operator best positioned to absorb rate shocks through sheer optionality. In fiscal year 2025, the port moved nearly 1.4 million containers, 506,000 vehicle units, and more than 10 million tons of cargo. Cargo activity through the seaport supports more than 258,800 jobs and generates about $44 billion in annual economic impact for the region and state.
The infrastructure story matters for cost. Work to increase the air draft to an operational clearance of 205 feet — allowing more vessels to access Jacksonville’s 47-foot deepwater harbor — remains on track for completion by the end of this year. Bigger ships mean lower per-container ocean costs, which partially offsets rising inland trucking rates. The multi-year SSA Jacksonville Marine Terminal expansion, completed in FY2025, densified a 93-acre facility designed to handle increased international cargo at deep-water berths, and the Southeast Toyota Distributors 89-acre auto processing facility became fully operational on December 1, 2025.
What sets Jacksonville apart for fleet operators is the modal mix. The port offers on-dock rail, 40 daily trains, integration with three U.S. interstates, and more than 100 trucking firms drawing on an 885,000-person labor force. When truck rates spike, Jacksonville shippers can shift longer-haul volume to rail in a way that Tampa and Miami shippers largely cannot. That flexibility is the single biggest reason Northeast Florida distribution centers have weathered 2026 better than their South Florida counterparts.
JAXPORT’s breakbulk business also grew sharply, with revenues rising to $7.1 million from $4.8 million in FY2024 and tonnage up 21%. Project cargo and heavy lift are less rate-sensitive than containerized consumer goods, giving the port a diversified revenue base.
Tampa Bay: Proximity as a Cost Weapon
Port Tampa Bay’s pitch to shippers has always been geography, and in a high-rate environment geography converts directly into dollars. Trucks moving cargo between Port Tampa Bay and Lakeland can make as many as three trips per day, compared with roughly one trip from some competing ports. When a dray driver’s daily cost is fixed and the per-mile rate is at record highs, tripling turns per day is the most powerful cost lever a fleet manager has.
The numbers behind the pitch are real. Container volumes have increased by more than 300 percent since 2018, with nearly 263,000 TEUs moving through the port in fiscal year 2025, and the port handled 32 million tons of total cargo that year, including petroleum, dry bulk, breakbulk, and project cargo. In April, the Zim Canada docked with 11,900 TEUs, nearly 2,000 more than any vessel previously handled at the port, and six post-Panamax cranes are expected to be operational by the end of 2026. The port also secured $10 million in federal funding for the Tampa Harbor Navigation Improvement Project, a six-phase effort expected to be completed by 2034.
The distribution base is what makes those volumes stick. The Central Florida region has over 550 million square feet of distribution center space in Port Tampa Bay’s backyard, and the region is one of the hottest industrial real estate markets in the country. Three Tampa Bay counties — Polk, Hillsborough, and Pasco — are among the fastest growing in the nation.
Cold chain is the growth vector. Port Tampa Bay processed roughly 170,000 TEUs in 2024 and expanded its automated cold storage capacity by millions of cubic feet; container throughput is projected to reach 185,000 to 195,000 TEUs in 2026, and Lineage Logistics and Americold are both evaluating Phase II cold storage expansions totaling more than 400,000 square feet of additional temperature-controlled space. Refrigerated freight carries the highest per-mile rates, so shortening the reefer dray from port to cold storage is where Tampa’s model produces the largest margin protection.
Dry bulk is expanding too. In May 2026, Cemex completed a $36 million expansion of its aggregates terminal at the port, increasing capacity for aggregates, cement, gypsum, and grain, with existing terminal users already committed to handling more than 5.7 million tons annually. And the port’s Vision 2030 projects include building warehouses, expanding container and shipping terminals, installing new cranes, and, starting next year, dredging the shipping channel by four feet.
South Florida: Highest Volume, Highest Pressure
South Florida’s two container ports posted records in FY2025 and are now feeling the cost squeeze most acutely. Port Everglades processed 1,167,552 TEUs during the fiscal year, the highest container volume in its history, and recorded record volumes in cargo, energy, and cruise simultaneously for the first time. It handled 131,855,261 barrels of petroleum products, supplying fuel to 12 counties and five international airports. PortMiami recorded 1,115,058 TEUs, up 2.35% and marking 11 consecutive years above one million TEUs.
Both ports are investing to keep throughput moving. Port Everglades’ updated Master/Vision Plan outlines approximately $3.8 billion in capital investments, and the $471 million Southport Turning Notch Extension expanded berth space and enabled six Super Post-Panamax gantry cranes. PortMiami completed phase two of its Electric Rubber-Tired Gantry Crane project, bringing the total to 18 eRTGs in the South Florida Container Terminal for higher stacking and more efficient yard runs.
The pressure point is the last mile. Published base drayage rates start at $500 for a move from PortMiami and $450 from Port Everglades to a Miami yard, with longer deliveries into Broward, Palm Beach, or Naples priced by mileage and appointment requirements. Round-trip pricing is standard — shippers pay for the empty return leg whether or not it appears as a line item — and containers over roughly 43,000 pounds require tri-axle equipment and overweight permits. Fuel surcharges, chassis per-day rental, and chassis splits appear on almost every Miami invoice, followed by pre-pulls when appointments slip, detention when unloading runs past free time, and port congestion fees during peak season.
Port Everglades’ advantage is transit time to Central America: imports from Guatemala and Honduras can reach South Florida in as little as three days, and the port handled more than 147,000 TEUs of refrigerated cargo in FY2025. For perishables, that speed justifies the drayage premium. For dry consumer goods bound for Orlando or Tampa, it increasingly does not.
How Fleets Are Adapting
The response across the three regions follows a recognizable playbook.
Port diversification. Central Florida-bound cargo that historically entered through Miami or Savannah is being rerouted through Tampa to cut the inland leg. Port Tampa Bay’s growth in container services from Asia, Central America, and South America — including the Cartagena-Tampa shuttle operated by Maersk and Hapag-Lloyd — gives shippers a credible alternative. The most sophisticated operators now split volume across two or three Florida gateways and rebalance monthly based on lane rates.
Drayage turn discipline. With per-mile rates at records, the cheapest container move is the one that avoids a second trip. Operators are negotiating longer free-time windows, pre-scheduling appointments, and staging containers at near-port transload yards so drivers can complete multiple turns per shift. In Tampa, that means three moves per day; in Miami, it means getting the Medley, Doral, and Hialeah warehouse corridor to turn containers inside two hours.
Technology integration. C.H. Robinson’s June update identified inland coordination — not terminal congestion — as the primary planning challenge at ports, with rail disruption, uneven container arrivals, and trucking constraints creating variability once cargo leaves the terminal. Shippers are advised to engage carriers and 3PLs proactively on routing-guide flexibility and load timing. In practice that means telematics on every tractor, appointment-scheduling systems tied to terminal gate data, and routing software that re-sequences deliveries daily as fuel and rate inputs change.
Fleet investment in the right places. Rather than adding raw capacity into a tight driver market, Florida fleets are buying equipment that raises revenue per driver: tri-axle chassis for overweight moves, reefer units for the cold-chain surge, and automated yard equipment that cuts dwell time. Cold storage operators evaluating 400,000-plus square feet in Tampa are doing so because the reefer dray is the highest-margin, shortest-distance move in the state.
Mode shift where rail exists. Jacksonville’s on-dock rail and Tampa’s CSX connection, including Kinder Morgan’s expansion to handle 100-car unit trains, give operators an outlet for long-haul volume when truck rates spike. South Florida, with thinner rail options, has less room to maneuver.
What It Means for Florida Businesses
- Importers and distributors — audit which port your cargo enters and where it is consumed. If the answer is “Miami” and “Orlando,” you are paying a premium that Tampa may erase.
- Trucking and drayage firms — the rate environment favors carriers for the first time in three years, but only those with the equipment and driver base to run multiple turns. Detention and accessorial discipline is now the profit center.
- Industrial landlords — near-port transload and cold-storage space in Tampa and Jacksonville is the asset class of the moment. Central Florida’s 550-million-square-foot DC base is not overbuilt when rates are this high.
- Cold-chain and pharma shippers — Tampa’s automated cold storage and Port Everglades’ three-day Central America transit are the two Florida assets to build around.
- Professional services — customs brokers, freight forwarders, and logistics attorneys in South Florida’s 1,400-firm brokerage community will see clients renegotiating contracts, free-time terms, and fuel surcharge formulas through year-end.
FAQ
Why did trucking rates spike in 2026?
Nearly three years of freight recession pushed carriers out of the market. When demand recovered and diesel stayed elevated, remaining capacity could not meet peak-season volume, and the National Truckload Index hit a record $3.83 per mile in June.
Which Florida port is cheapest for Central Florida deliveries?
Port Tampa Bay, in most cases. Its proximity to Lakeland and the I-4 corridor allows up to three dray turns per day versus roughly one from competing ports.
What does drayage cost in South Florida?
Published base rates start around $450 from Port Everglades and $500 from PortMiami for a local move, before fuel surcharge, chassis rental, and accessorials.
Is Florida’s freight problem congestion or cost?
Cost. Terminal throughput is at records at all four major ports; the constraint is inland coordination, driver availability, and per-mile pricing.
Are the ports still investing despite the cost pressure?
Yes. JAXPORT’s harbor and terminal upgrades, Port Tampa Bay’s cranes and channel dredging, Port Everglades’ $3.8 billion plan, and PortMiami’s eRTG expansion are all proceeding.
Brian’s Take
Three years of cheap trucking made a lot of Florida distribution networks lazy. Cargo entered wherever the ocean rate was best and got trucked wherever it needed to go, because the inland leg was nearly free. That era ended in June.
The winners in this cycle are not the biggest fleets; they are the operators who treat the dray as a precision instrument. Tampa’s three-turns-a-day math is not marketing — it is the difference between a profitable and an unprofitable lane at $3.83 a mile. Jacksonville’s rail optionality is worth more today than it was at any point since 2022. South Florida’s ports will keep setting records because Latin American perishables have nowhere else to go, but the dry-goods importer who keeps routing Orlando-bound containers through Miami is subsidizing a habit.
My watch item is the fourth quarter. If the National Truckload Index holds above $3.50 through peak season, expect the port-diversification shift to become permanent rather than tactical, and expect Tampa’s 2026 container projection to be beaten. If rates roll over, the operators who invested in cold-chain capacity and yard automation still come out ahead — those investments pay in any rate environment. The ones who simply bought more trucks into a tight driver market will not.
How the Florida Authority Network Helps Florida Businesses
PressReleaseFlorida.com is one of four press-release brands within the Florida Authority Network, a portfolio of 35 answer-engine-optimized business news sites covering Florida’s regions and industries, including JacksonvilleBusinessNews.com, TampaBayBusinessNews.com, and MiamiBusinessNews.com. Logistics firms, port-adjacent developers, trucking companies, and the professional services that support them can distribute press releases and verified company profiles across multiple FAN sites, giving AI search engines and procurement teams a consistent, authoritative record of who they are and what they do. For placement inquiries, call 813-409-4683.
Sources and Further Reading
- JAXPORT Highlights Infrastructure Progress and Long-Term Strategy at 2026 State of the Port — jaxport.com, Feb. 26, 2026
- JAXPORT Financial Reports, Fiscal Year 2025 — jaxport.com, March 2026
- JAXPORT Cargo Overview — jaxport.com
- Port Tampa Bay Receives Largest Containership as Growth Continues — The Maritime Executive, April 10, 2026
- Port Tampa Bay Charts a Bigger Course with Major Expansion Projects — Business Observer, June 19, 2026
- Tampa Bay Economy Enters a More Selective Phase — Tampa Bay Business & Wealth, June 1, 2026
- Port Tampa Bay — Inbound Logistics Planner, Aug. 2025
- Tampa’s Cold Chain Boom Has Outpaced the Workforce That Runs It — KiTalent, April 12, 2026
- Port Everglades Shatters Its Own Records — porteverglades.net, Dec. 5, 2025
- Port Everglades: A Diversified Cargo Gateway Built for Performance — The Maritime Executive, March 17, 2026
- PortMiami Announces a Banner Year for Cruise Passengers and an Increase in Cargo TEU Volume — Miami-Dade County, Dec. 2, 2025
- ITS Logistics June Freight Index: Drayage and Intermodal Markets Face Downstream Price Surges — MarketScale, June 24, 2026
- Freight Market Update: May 2026 — GM International Freight Forwarders
- How Much Does Container Drayage Cost in Miami? (2026) — Go Drayage, July 6, 2026
- Container Drayage Rates in Miami: A 2026 Cost Guide — Go Freight, April 24, 2026
- Best Trucking Companies Florida: Freight Rates 2026 — ParcelPath, March 2026
About Brian French
Led by a commitment to tech-intelligent curation, Brian French tracks and analyzes corporate developments and writes Press Releases on Florida's dynamic companies, leaders and economy. Brian brings an extensive financial background to his analysis, having graduated from the University of South Florida in Finance and serving as a Vice President and Portfolio Manager for Merrill Lynch Private Investors and the Trust Department in St. Petersburg, FL, as well as a Vice President and Trust Investment Officer for SunTrust Bank in Sarasota, FL. His writing blends macroeconomic trends, capital markets, corporate strategy, and modern digital insights for a sophisticated look at Florida's business market.